 Victor Dumeige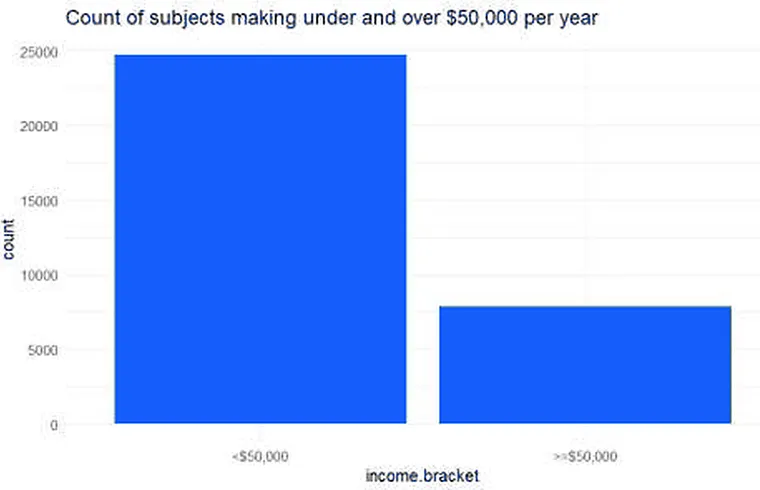
A logistic regression on 1994 US Census data testing which socio-economic factors predict crossing the $50,000 income threshold.
Logistic RegressionRCensus DataStatistical Modeling
View case study
Data work from my MS in Data Analytics at Oregon State and from client campaigns — measurement, reporting, and the analysis behind decisions.
A logistic regression on 1994 US Census data testing which socio-economic factors predict crossing the $50,000 income threshold.
View case study
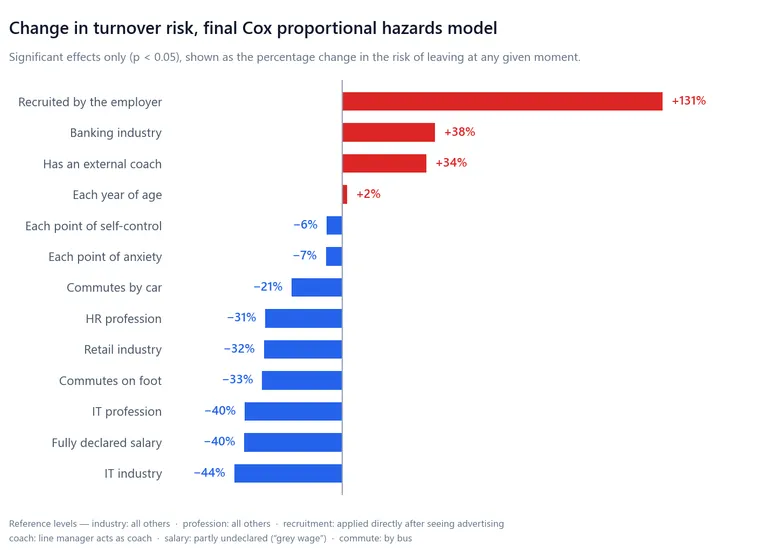
A survival analysis of 1,129 employees across retail, banking, IT, manufacturing, and other industries, testing which factors make people leave sooner.
View case study
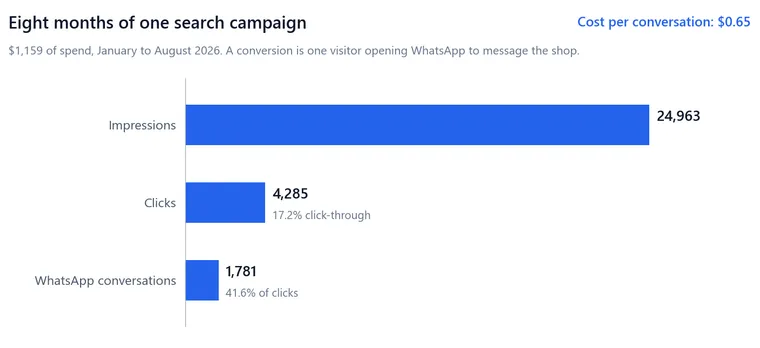
Eight months of Google Ads and GA4 for a Mercedes-Benz parts shop in Costa Rica — what the money bought, and what the two tools disagree about.
View case study
I take analytics engagements alongside web development and organizational consulting, in English, Spanish, or French. Email is the surest way to reach me.